Fields and Isolines
A field is a type of map that shows some sort of data. The data could be anything from air pressure, to temperature, to pollution, to elevation. To make field maps easier to read, we often draw in isolines, which are lines that connect points of equal value. Different types of isolines have different names.
- Air Pressure isolines- Isobars
- Air Temperature Isolines- Isotherms
- Elevation Isolines- Contour Lines
When drawing isolines, you must follow these guidelines:
- All isolines must be smooth and curving, separating larger values from smaller values
- Isolines can never touch or cross
- Isolines can never end abruptly in the middle of a map, they must either run to the edge, or close on themselves
Field maps that show elevation data are called topographic maps, or contour maps. Contour lines on topographic maps show locations of equal elevation. From these maps, you can determine the appearance of a landscape (hills, valleys, depressions, etc.). Here are some key ideas to consider when examining topographic maps:
- The closer together the contour lines, the steeper the slope.
- Streams and rivers always flow downhill, from high to low elevation.
- Contour lines bend forming “V’s” when they cross rivers, these “V’s” always point upstream, opposite the direction the stream is flowing.
- The highest elevation will always be higher than the highest contour line, but lower than what the next contour line would be.
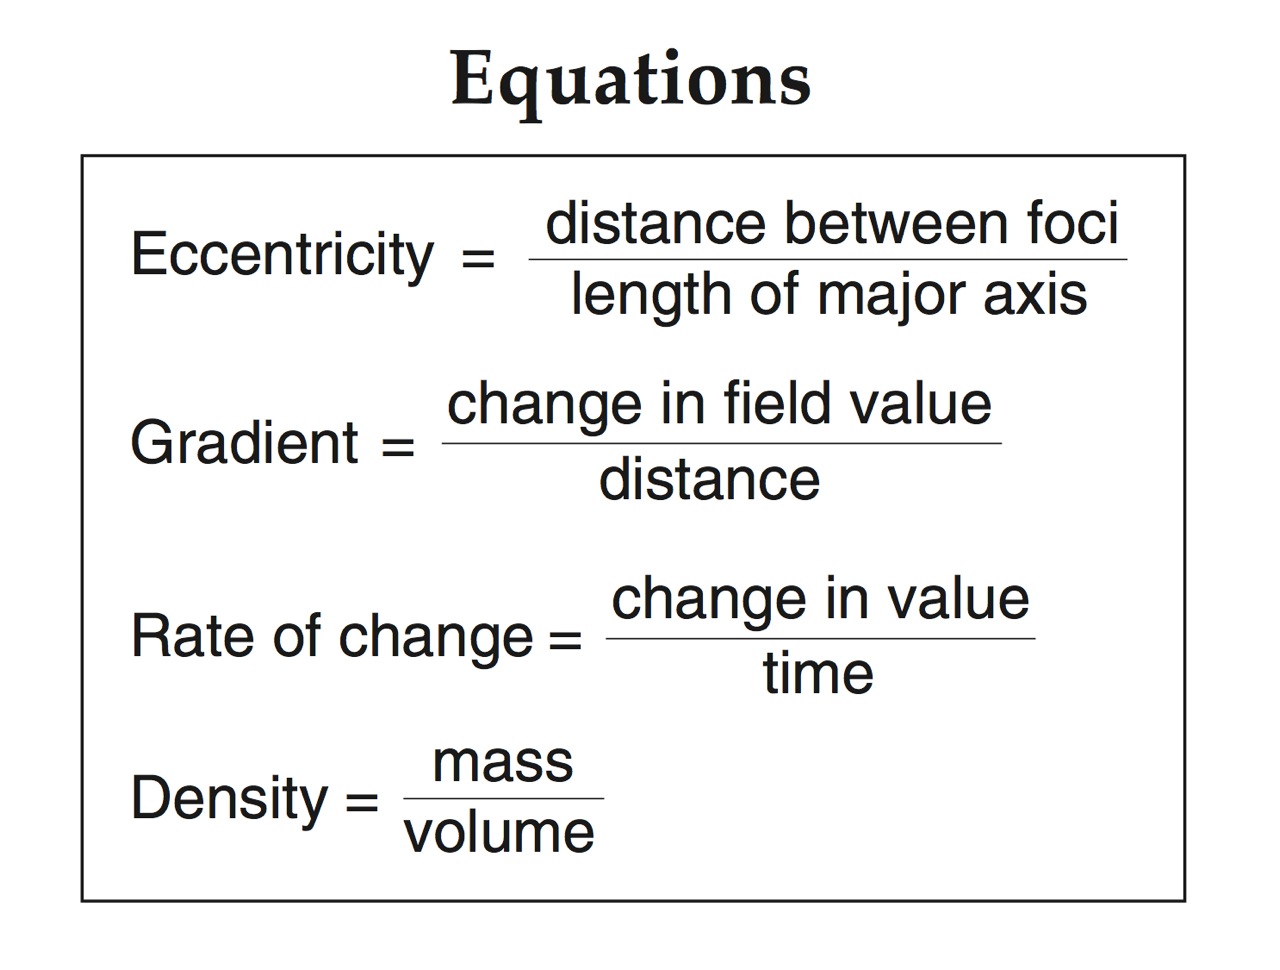
- Gradient is a measure of the steepness of a slope. It can be calculated using the formula on page 1 of the ESRT. Higher gradients mean steeper slopes, while lower gradients mean a flatter slope.